Slow-query traces
Export ClickHouse native spans enriched with query-log context so slow traces carry the database behavior that caused them.
Click-Dog reads spans and query logs straight from ClickHouse and turns them into traces, query families, and dashboards for Datadog, Splunk, Honeycomb, Grafana Tempo, and any OTLP backend — read-only and bounded, so it never becomes another production load risk.
curl -fsSL https://github.com/coltconsulting/click-dog/releases/latest/download/install.sh -o install.sh && sudo bash install.sh
Signed and checksummed before install.
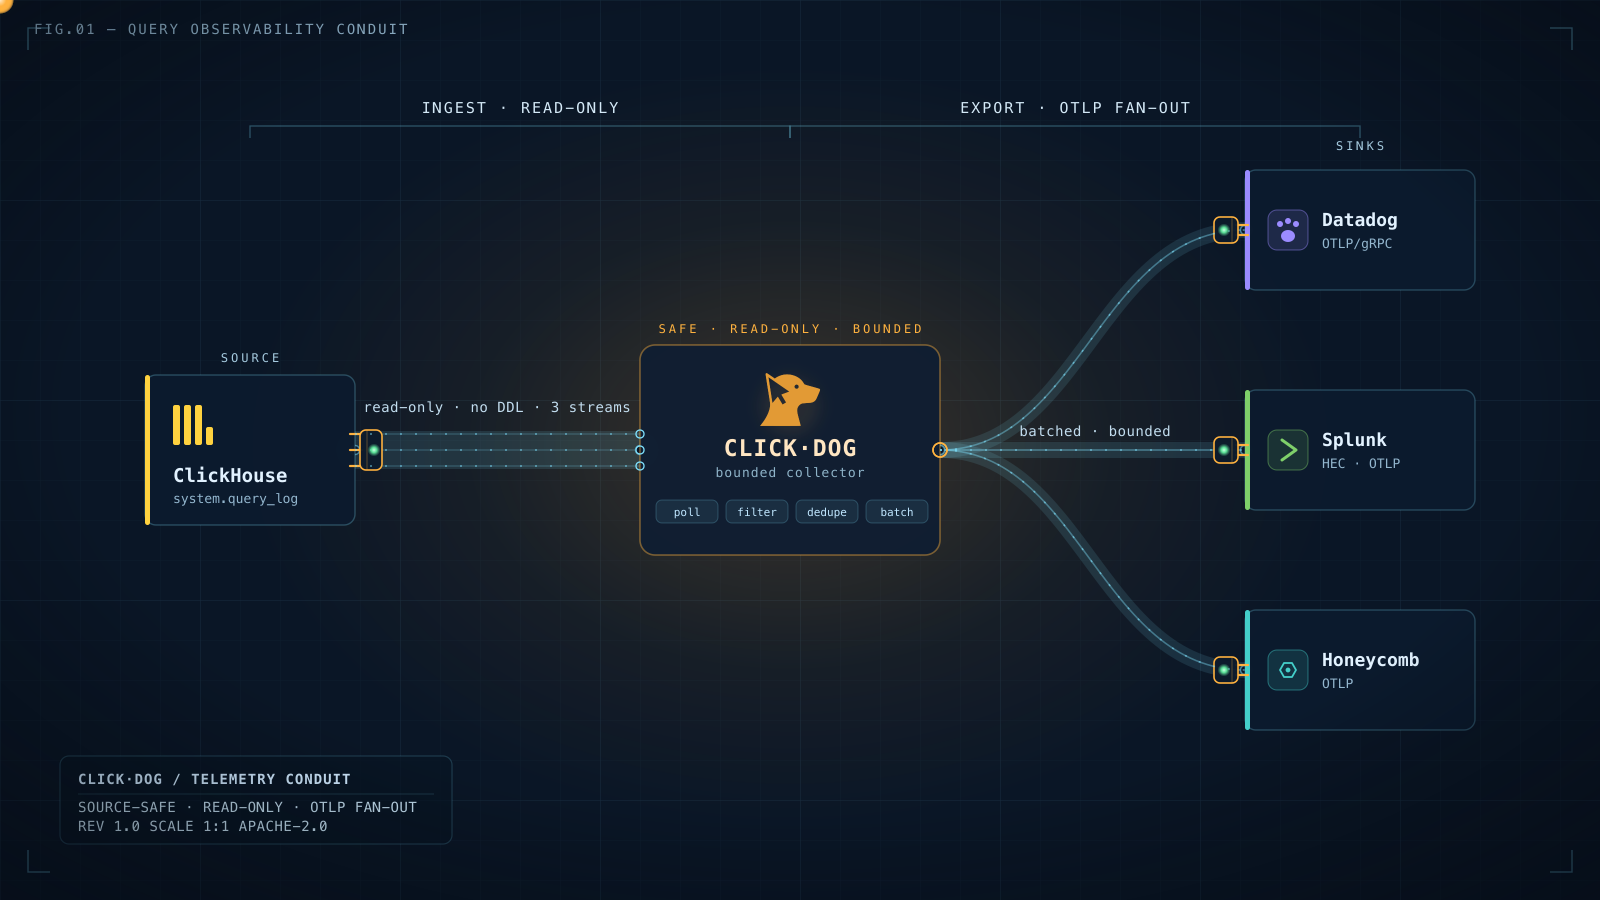
Three things shape Click-Dog: it's manageable to run, it stays out of your source system's way, and it explains what your queries are doing.
Run it as a single static binary, a container, or generated Kubernetes / Docker Compose manifests. Validate config before it talks to anything, dry-run exports, and monitor Click-Dog itself.
The non-invasive property. Read-only connections, bounded polling, SQL-level filtering, batching, circuit-breaker protection, and adaptive backoff — so your source system stays in control.
Click-Dog exports spans, but the goal is to explain queries: slow-query traces, query-log enrichment, normalized query families, log-comment context, and ready-made dashboards.
Click-Dog does more than forward spans. It packages the reports, dashboards, export health, and rollout controls a team needs before trusting a production telemetry path.
Export ClickHouse native spans enriched with query-log context so slow traces carry the database behavior that caused them.
Group thousands of statements into normalized shapes that make p95, volume, and trend changes easier to reason about.
Provision Datadog application query-analysis dashboards without starting from a blank canvas.
Know which backend is accepting spans, which one is failing, and when fan-out needs operator attention.
Run as a static binary, systemd service, Docker Compose stack, Kubernetes deployment, or Ansible-managed sidecar fleet.
Generate bounded read-only reports, including redacted JSON for downstream tooling and AI-assisted review.
Click-Dog sits beside your database — never in the request path — reads telemetry over a read-only connection, filters and batches at the source, then fans out to one or more backends.
Roll normalized_query_hash values into stable shapes, then compare volume, p95, and outliers.
Enrich query root spans with system.query_log metrics and log_comment metadata.
Start from a query, query ID, trace ID, or normalized hash and follow it through spans and family findings.
Generate a read-only report with redacted JSON for operators, downstream tooling, or AI-assisted review.
Click-Dog should make query telemetry easier to trust without making the source system harder to operate.
Static Linux binary for a quick first node or a controlled manual install.
Installer-generated service, config validation, and local health checks.
Generated manifests for a centralized cluster reader with readiness probes.
Fleet rollout, canary playbook, bounded concurrency, and repeatable config.
One YAML file and one command. Validate it, dry-run the export, then turn it on.
clickhouse:
  host: localhost
  port: 9000
  username: default
  password: ${CLICKHOUSE_PASSWORD}

exporters:
  otel:
    - collector_address: localhost:4317
      service_name: click-dog-monitor

monitor:
  enabled: true
  min_trace_duration_ms: 1000
  check_interval_s: 30

log_level: info
# 1 · validate before it talks to anything
$ ./click-dog -validate -config click-dog.yaml
✓ config valid · 1 source · 1 sink

# 2 · dry-run the export pipeline
$ ./click-dog --dry-run -config click-dog.yaml
→ 248 spans matched · 0 sent (dry-run)

# 3 · run it
$ export CLICKHOUSE_PASSWORD="secret"
$ ./click-dog -config click-dog.yaml
● collector up · leader · exporting
  clickhouse → otel://localhost:4317 healthy
Open source under Apache 2.0 — run, modify, and redistribute it under the license terms. Read-only by design, and live in minutes.